AT 309 Lab 10: Projections
Introduction
The use of projections and coordinate systems in GIS is important. The use of these systems allows for geospatial data to be relative to the real world and do so in an accurate manner. The Earth is not a perfect sphere, in fact, it can be described as an oblate ellipsoid. Figure 1 shows the shape of the Earth.
Figure 1: This is the relative shape of the Earth, where the area around the equator comes out farther than the poles.
Even though it can be assumed the Earth is this shape, it is not entirely perfect. The surface of the Earth changes and is not symmetrical. Since there are these inconsistencies, different spheroid models have been used to estimate the surface of the Earth for geographical coordinate systems. Two examples are the Clarke 1866 and WGS 1984; these are both commonly used spheroids. For GIS platforms, it is common to use projections for projects that relate to different spheroids that have been created.
In cartography, it is common for different types of maps and projections to be used. Some of the more common types are conformal, equal area, equidistant, azimuthal, gnomonic, and compromise. The main areas of geometric properties for projections are distance, direction, scale, and area. For all of these types of projections, only one property (Except for gnomonic with two properties) is preserved. With common sense, it can be assumed that these projections do not align with each other and create inconsistencies.
The main purpose of Lab 10 was to address these inconsistencies and learn the importance of projections. The ESRI Training platform was used throughout the lab; the Introduction to Coordinate Systems was the lesson that was used and a certificate of completion was generated after it.
Discussion
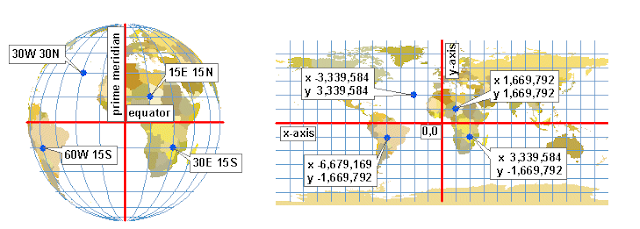
The ESRI Training lesson was informative in teaching about coordinate systems and projections and how they are important to GIS. The lesson was split up into three sections with each consisting of an exercise that required the use of ArcGIS Pro and a quiz to ensure understanding. To understand how projections are set up, it is required to know how the coordinate system works. Figure 2 shows the coordinate system on a model of the Earth.
Figure 2: This is the coordinate system that is currently used; the equator runs horizontally, while the prime meridian runs vertically.
The coordinate system helps to geographically (Geographic Coordinate System = GCS) reference different areas on the Earth. Projections help to create a two dimensional graphic of the Earth, and they are incorporated with their own coordinate system (Projected Coordinate System = PCS) that relate to the GCS.
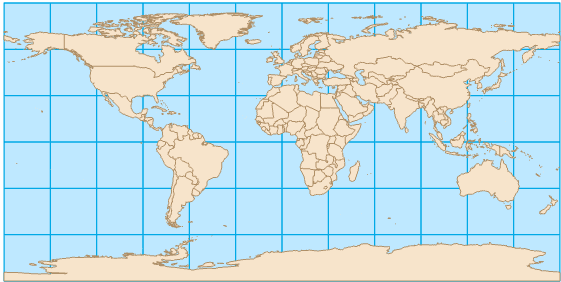
For the duration of the lab, the data set provided from the lesson used a conformal projection. Figure 3 shows what is seen when first opening the data.
Figure 3: This is the conformal projection that is generated when first opening the downloaded data.
For the first part of the lab, different projections were looked into. Long Island was used for reference. The projections that were used are WGS 1984 (Referenced in orange), International 1924 (Green), and Clarke 1866 (Purple). Figure 4 shows all of the layers being overlayed.
Figure 4: This is a view of Long Island from a 1:300,000 view, and at this view, it is hard to see the differences.
As can be observed, the differences between the three projections are rather difficult to see and would need a closer view to fully see them. The default view for the data was 1:300,000 meters. The majority of projection differences cannot be seen from this view, so for Figure 5, it is observed at 1:30,000.
Figure 5: As the scale decreases in size, the differences increase in noticeability. It becomes apparent the importance of PCS and GCS when working with GIS.
The differences in the three PCS is now noticeable. These can cause issues when working with geospatial data because uncertainties and assumptions will lead to errors. It is also important to use the correct GCS that relates to the PCS of the data to correctly project their actual geolocation. For reference, Figure 6 will go into further depth to show the margin of difference.
Figure 6: The Measure tool was used to find the difference between WGS 1984 and Clarke 1866, which shows a distance of 235.13 meters.
That difference of 235.13 meters is significant, especially if there is an error with switching incorrectly between WGS 1984 or Clarke 1866. The use of the correct PCS is important. Without the correct PCS, the geolocation of the data is inaccurate and is practically useless. To reinforce this idea, part two of the lesson deals with using different waypoints and correctly inputting them into GIS software. Figure 7 will show a table of the data that used over Africa.
Figure 7: This table shows cities and their locations on a respective PCS.
The main purpose of this second lesson was to show the importance of tying a PCS to a GCS and the impact of correctly doing so. When transferring the table to ArcGIS Pro, if the incorrect GCS is selected, it will incorrectly place data. Figure 8 shows what happens when some data is incorrectly placed.
Figure 8: This is the city information when symbolized, and an incorrect input is being shown in red.
Unless there is a new city off the coast of Africa, there is an error when inputting some sample data. As we can see, the data point is far off from the land, and it happens to be a significant amount of distance from it. This would create a great amount of issues if trying to sail to port within Africa. The possibility of issues is too high, and it is important to address these and be preventive of them. For the last lesson, local projections were used to better understand the need of corrections and how local projections show an area accurately. Figure 9 will show Alaska without any local projections.
Figure 9: This is Alaska on a conformal projection.
Something seems off about it, does it not? Well if you said yes, you would happen to be correct! The main issue with conformal projections are typically the edges since compromises are needed to make the map fit within a rectangular plane. To better represent distorted areas, there are local projections that are created to better show certain areas that are typically distorted. The purpose is to make that specific area accurate and accurately project it. Figure 10 will show Alaska in a conic projection.
Figure 10: This is Alaska under the conic projection, where the shape of the state is more accurate.
As we can observe, the shape of the state looks a lot more accurate and is not warped like the other projection. This projection would give an accurate view of the state and can be used for referencing. The warped view of it with the conformal projection would lead to inconsistencies in different PCS's and would give incorrect information.
Conclusion
Lab 10 was insightful in the importance of coordinate systems and projections. Accuracy is key in the use of these systems. Lining up the correct PCS and GCS ensure complete accuracy in projecting the actual geolocation of the data. Knowing which GCS the data is referencing is also important in ensuring that there is not any confusion. As we observed, initializing the table within ArcGIS Pro resulted in a data point being misaligned with Africa by a good margin. Local projections are also important in projecting certain areas that typically result in being warped by other projections.
Projections and coordinate systems are important for UAS because they can be used for geospatial data or for simply geolocating certain data points. PCS and GCS are used for GIS applications, and UAS has the capability of using such applications; the same issues apply for when transferring the data from the UAS. The understanding of which GCS is being referenced when the data is being generated ensures accuracy and usability.


Comments
Post a Comment